
📣 Create Blog for Traders!
Stop Watching news - Start Making it.
START


Pump.fun Trading Stats 2026: The Harsh Reality of Meme Coin Investing
By On-Chain Analytics & Trading Desk | Last Updated: February 14, 2026
The allure of turning a few dollars into a fortune overnight has driven hundreds of thousands of retail participants to decentralized exchanges (DEXs). In the 2025-2026 cycle, Solana-based launchpads have become the epicenter of this speculative frenzy. However, recently published on-chain data has shattered the illusion of easy money.
A comprehensive analysis of recent Pump.fun trading stats reveals a sobering truth: the vast majority of participants are serving as exit liquidity for a microscopic fraction of insiders and automated bots. If you are entering this market expecting to print money, the math is overwhelmingly against you.
Risk Disclosure: Trading micro-cap cryptocurrencies and meme coins on decentralized exchanges carries an extreme risk of total capital loss. These assets are highly speculative, often lack fundamental value, and are heavily manipulated. Historical data shows that over 90% of retail traders lose money in these environments. Never risk money you cannot afford to lose.
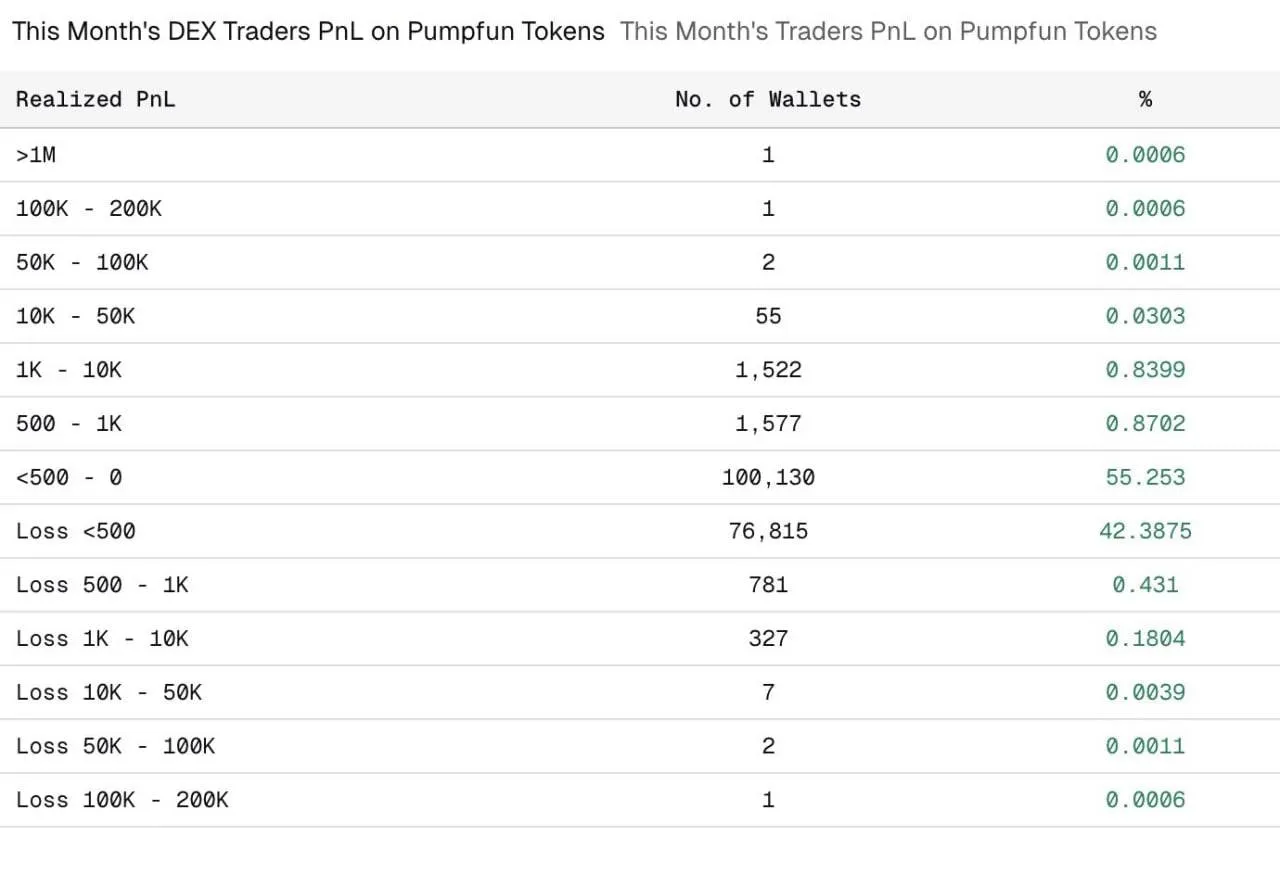
Featured Snippet Answer: Recent Pump.fun trading stats reveal that out of approximately 180,000 tracked wallets, 42% realized outright losses, while 55% merely broke even or secured negligible profits. Only 1.7% of traders managed to earn over $500. Most shockingly, life-changing wealth is virtually a myth: only 4 individual wallets out of 180,000 achieved profits exceeding $50,000.
Let's break down the exact distribution from the recent on-chain data report shared via X:
- The Breakeven Majority (55%): These wallets saw no meaningful return. Factoring in Solana network priority fees and transaction costs, many of these "breakeven" accounts are practically operating at a net loss.
- The Confirmed Losers (42%): Almost half of all participants watched their capital evaporate.
- The Minor Winners (1.7%): A tiny fraction walked away with more than $500.
- The Lottery Winners (0.002%): Exactly 4 wallets out of 180,000 crossed the $50,000 profit threshold.
To understand why the failure rate is so catastrophic, we must look beyond the hype and examine the structural mechanics of platforms like Pump.fun and standard Automated Market Makers (AMMs).
Tokens launched on these platforms typically use a bonding curve. As more people buy, the price increases exponentially. Early buyers (often the token creators or snipers) get in at near-zero valuations. By the time the token gains traction on social media and retail traders buy in, the curve has steepened. The late buyers provide the exact liquidity needed for the early adopters to cash out, instantly crashing the price.
You are not just trading against other humans; you are trading against highly optimized algorithms. Maximal Extractable Value (MEV) bots monitor the mempool for pending transactions.
- When you place a large buy order, a bot will pay a higher network fee to buy the token before you, pushing the price up.
- Your order executes at this newly inflated price (suffering massive slippage).
- The bot immediately sells the token back into the pool, pocketing the difference. You are left holding a devalued asset.
For a deeper understanding of market mechanics and liquidity, Investopedia’s guide on Market Microstructure is essential reading.
It is easy to look at a chart on DexScreener and calculate hypothetical profits. Executing those trades is an entirely different reality.
A 2025 Trading Scenario Gone Wrong: Last year, while testing new sniping setups using tools like Photon and BullX, I identified a token graduating from the bonding curve to the Raydium DEX.
- The Setup: The chart looked incredibly bullish, printing green candles. I initiated a buy order for 10 SOL.
- The Reality: Due to low liquidity and a sudden influx of sell orders from insider wallets, the transaction suffered a 35% slippage impact.
- The Result: By the time the trade settled on-chain, my position was already down by a third. When I attempted to cut my losses and sell, the lack of bid liquidity meant I lost another 20% on the exit. A "good setup" turned into a 55% loss in under three minutes.
This is why regulatory bodies like the SEC consistently warn against the dangers of micro-cap and "pump and dump" schemes. The liquidity is a mirage.
Social media feeds are flooded with screenshots of traders turning $50 into $50,000. This is a textbook example of survivorship bias. You are seeing the 4 wallets out of 180,000. You are not seeing the 75,000 wallets that went to zero.
Furthermore, on-chain sleuths frequently discover that the wallets making the largest profits are often:
- Connected to the token developers (insider trading).
- Operating advanced sniper bot infrastructure that costs thousands of dollars a month to maintain.
- Sybil rings designed to create the illusion of organic volume.
If you still choose to participate in this highly asymmetric environment, strict risk management is the only barrier between you and the 42% loss statistic.
- Accept Total Loss: Treat every deployment as a 100% loss the moment you sign the transaction. Never use portfolio capital you rely on.
- Understand Risk-to-Reward: As highlighted by professional trading platforms like TradingView's educational resources, a skewed Risk/Reward ratio is fatal. If your win rate is only 2% (as the stats suggest), your winners must be astronomically large just to break even—a mathematical improbability for most.
- Use the Right Tools: Never use standard retail wallets for fast execution. Utilize specialized RPC nodes and trading terminals, and always set strict slippage limits to prevent MEV sandwich attacks.
Q: Can I reliably make a living trading meme coins on Pump.fun? A: Statistically, no. The data shows only 1.7% of wallets make more than $500. It should be viewed as gambling, not a sustainable trading strategy or career path.
Q: What is a bonding curve on a DEX? A: A bonding curve is a mathematical formula that dictates the price of a token based on its available supply. As tokens are bought, the supply decreases, and the price of the next token automatically increases.
Q: Why does my transaction fail when trying to sell a profitable token? A: This is usually due to a lack of liquidity or insufficient slippage tolerance. If the price drops rapidly while your transaction is pending, and it exceeds your slippage limit, the smart contract will reject the trade to protect you, but you will still pay the network fee.
- Primary Data Source: X (Twitter) - @gem_detecter On-Chain Report
- Market Mechanics: Investopedia - Market Microstructure
- Regulatory Warning: SEC - Microcap Stock Basics (Pump & Dump Risks)
- Risk Management Education: TradingView - Risk Management Fundamentals