
📣 Create Blog for Traders!
Stop Watching news - Start Making it.
START


Bullish “Adam & Eve” Pattern Forms on Bitcoin Chart — Analysts
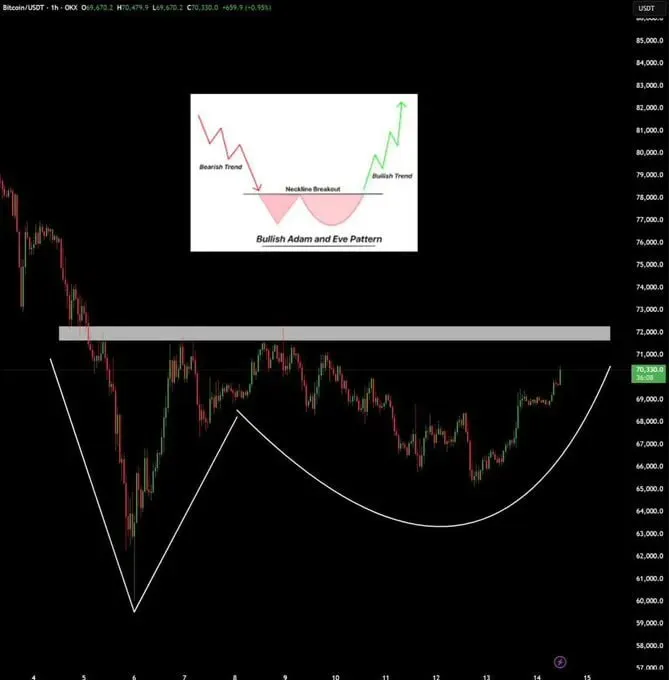
Crypto analyst Ash Crypto pointed to the formation of a bullish “Adam and Eve” pattern on the Bitcoin chart, suggesting that a breakout above $72,000 could open the path toward $80,000.
The “Adam and Eve” formation typically consists of:
- a sharp V-shaped bottom (“Adam”)
- followed by a rounded consolidation (“Eve”)
- breakout confirmation above neckline resistance
If confirmed, the structure often signals a momentum-driven upside extension.
Michaël van de Poppe, founder of MN Trading, expressed a similar view, noting that Bitcoin has successfully held a “potential bounce zone”, reinforcing short-term bullish structure.
However, trader Daan Crypto highlighted that the Coinbase premium remains significantly negative, a condition that has persisted for much of 2026.
A sustained discount typically reflects:
- weaker US spot demand
- institutional selling pressure
- net outflows from spot Bitcoin ETFs
According to Daan, the negative premium is likely tied to:
- ongoing bearish market structure
- persistent spot ETF outflows this year
On one side: 📈 Bullish technical breakout setup
On the other: 📉 Weak US spot demand signals
The next key level remains $72,000 — a decisive break could shift momentum, while rejection may reinforce distribution dynamics.