
📣 Create Blog for Traders!
Stop Watching news - Start Making it.
START

SP 500 Crash Risk: NYSE High-Low Index in 2026
By Macroeconomic Market Strategy Team | Last Updated: February 16, 2026
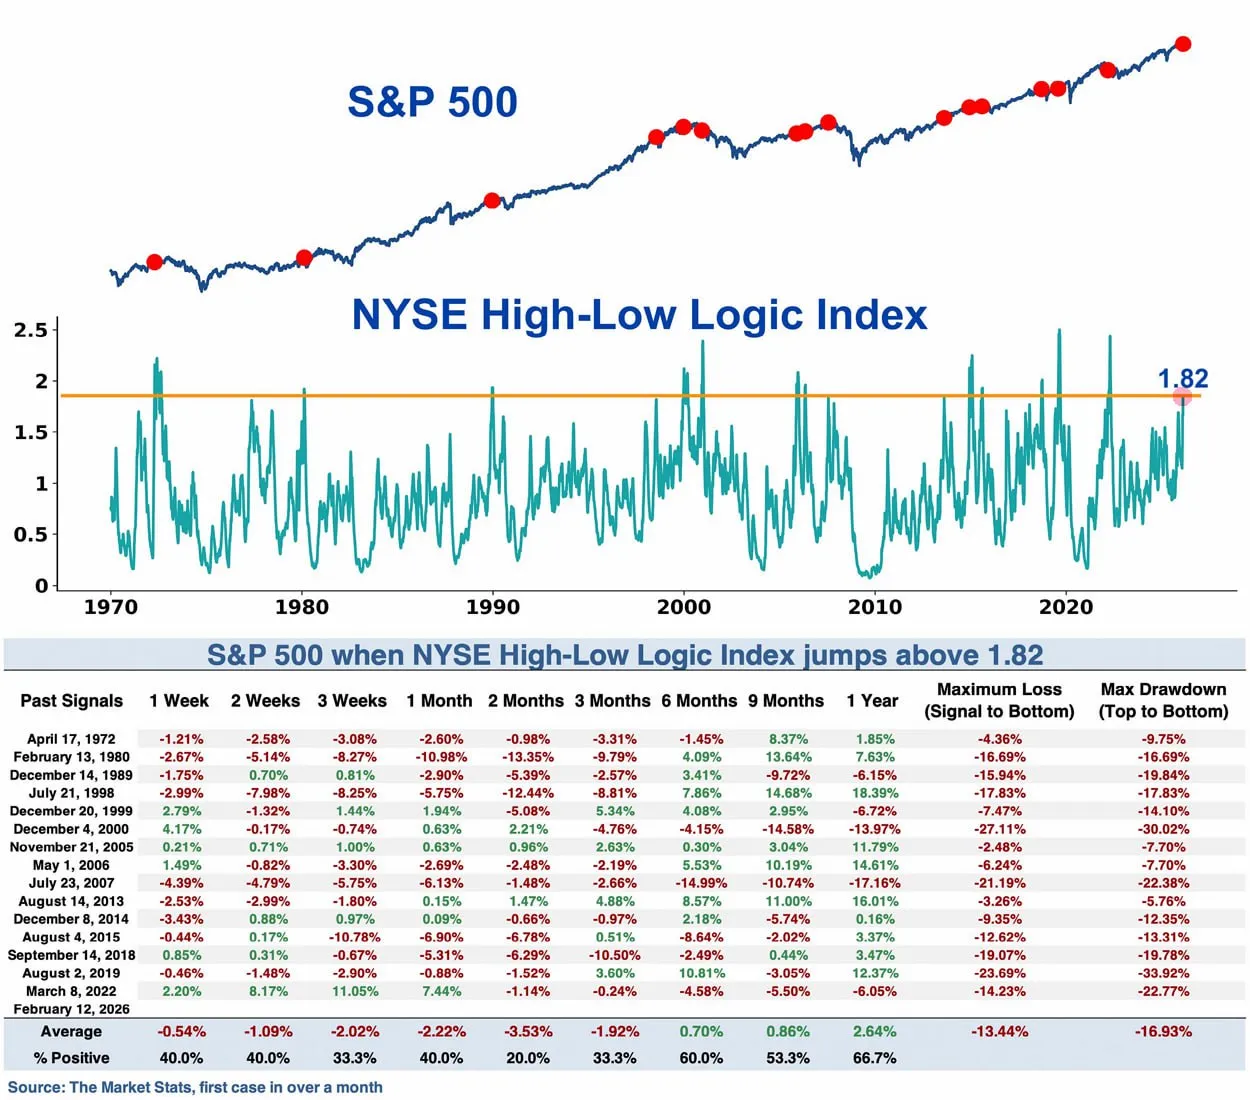
The US stock market is currently displaying a severe internal contradiction. While headline indices continue to push boundaries, underneath the surface, market breadth is deteriorating rapidly. Many individual stocks are hitting 52-week new lows at the exact same time mega-cap stocks are hitting new all-time highs.
This extreme polarization has pushed the NYSE High-Low Logic Index past the critical 1.82 threshold—a historical extreme. Historically, this signal precedes a massive market correction. However, as we navigate the political landscape of 2026, traditional indicators are clashing with aggressive government intervention ahead of the mid-term elections.
Risk Disclosure: Attempting to short the S&P 500 or trade based on macroeconomic indicators involves a high risk of capital loss. Markets can remain irrational longer than traders can remain solvent. The SEC strictly advises retail investors to fully understand the risks of margin calls and leveraged ETFs before betting against market trends.
Featured Snippet Answer:
The NYSE High-Low Logic Index is a market breadth indicator that measures the fragmentation of the stock market. It signals danger when a large number of stocks are hitting 52-week highs and 52-week lows simultaneously. A reading above 1.82 indicates extreme market disarray and historically predicts an S&P 500 correction.
To understand the mechanics, we must look at the math behind the indicator. Created by Norman Fosback, the core calculation compares the lesser of two ratios against the total number of issues traded.
The underlying logic is expressed mathematically as:
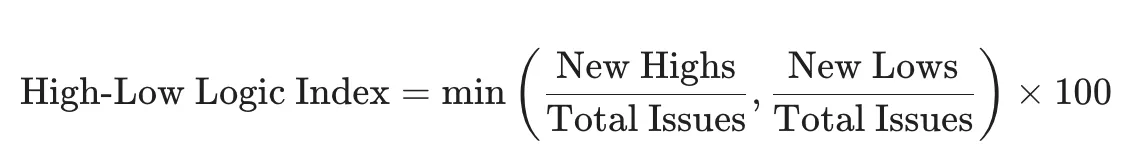
Note: In professional charting software like TradingView, this raw value is typically smoothed using a 10-day Exponential Moving Average (EMA).
When both new highs and new lows are elevated simultaneously, it means the market lacks a unified direction. It is the definition of a fragmented, unstable environment.
The data attached to this indicator is sobering. According to historical market breadth studies:
- The Probability: When the index spikes above the 1.82 extreme, the S&P 500 has historically experienced a severe drop within a 2-month window in 80% of recorded instances.
- The Severity: The average maximum drawdown during these corrective periods is approximately 17%.
For an index like the S&P 500, a 17% drop wipes out trillions of dollars in market capitalization. It triggers margin calls, forces algorithmic selling, and induces retail panic. For a deep dive into how market breadth precedes corrections, Investopedia's breakdown of Market Breadth is highly recommended.
While the technical data screams "sell," the macroeconomic and political reality of 2026 presents a massive headwind for short sellers.
We are in a critical mid-term election year. The Trump administration has historically viewed the S&P 500 as a real-time scorecard of its economic success.
- The Political Put: Many institutional analysts note that a 17% market crash just months before the November 2026 mid-terms would be catastrophic for the incumbent party.
- Intervention Mechanisms: The administration, in coordination with sympathetic monetary policy adjustments, has multiple levers to pull. This includes pressure for rate cuts, emergency liquidity injections, or targeted fiscal stimulus to prop up mega-cap tech and industrial sectors.
This creates a dangerous paradigm where fundamental indicators are temporarily broken by immense liquidity. "Don't fight the Fed" has evolved into "Don't fight the administration."
Relying solely on an indicator, even one as accurate as the High-Low Logic Index, without considering the broader context can lead to catastrophic trading failures.
A Professional Trading Failure Scenario (2025 Market Squeeze):
In analyzing professional trading desk post-mortems from early 2025, a recurring failure scenario emerged.
- The Trade: Traders noticed severe market breadth divergence (similar to today) and began aggressively shorting E-mini S&P 500 futures (ES) and buying VIX call options.
- The Mistake: They underestimated the sheer volume of passive capital flowing into the top 5 mega-cap stocks.
- The Result: While 495 stocks in the S&P 500 bled slowly, the top 5 rallied hard on AI revenue surprises. The index stayed flat or climbed slightly, effectively grinding the short-sellers into submission through margin calls. The "correction" didn't happen until months later, long after the early bears had blown up their accounts.
Actionable Insight: Being early in a short position is mathematically identical to being wrong.
If you are navigating this highly polarized market, traditional buy-and-hold strategies may be exposed to hidden risks.
- Avoid Blind Shorting: Do not short the market purely because an indicator is overbought. Wait for a confirmed technical breakdown in price action on high volume.
- Review Portfolio Concentration: Check your exposure. Are your gains coming from a diversified base, or are you entirely reliant on three tech stocks holding up the index?
- Hedge with Options, Not Margin: If you believe the 17% drawdown is imminent, purchasing out-of-the-money put options offers a defined risk profile. You can only lose the premium paid, avoiding the infinite risk associated with naked shorting. Babypips offers great foundational knowledge on defined risk.
Q: Can the stock market crash if the President wants it to go up?
A: Yes. While government stimulus and verbal intervention can delay a correction and inject liquidity, structural economic issues (like a credit crisis or unexpected inflation spikes) can overwhelm political efforts.
Q: Should I sell all my stocks if the High-Low Logic Index is above 1.82?
A: No. Market timing is notoriously difficult. This indicator suggests heightened risk and the need for hedging or rebalancing, not necessarily a total liquidation of long-term investments.
Q: What is the best way to track market breadth myself?
A: Most advanced charting platforms provide breadth indicators. You can track the Advance/Decline line (A/D line) or the McClellan Oscillator as secondary confirmations to the High-Low index.