
📣 Create Blog for Traders!
Stop Watching news - Start Making it.
START


XRP Capitulation 2026: Realized Losses Spike
By On-Chain Analytics & Trading Strategy Desk | Last Updated: February 22, 2026
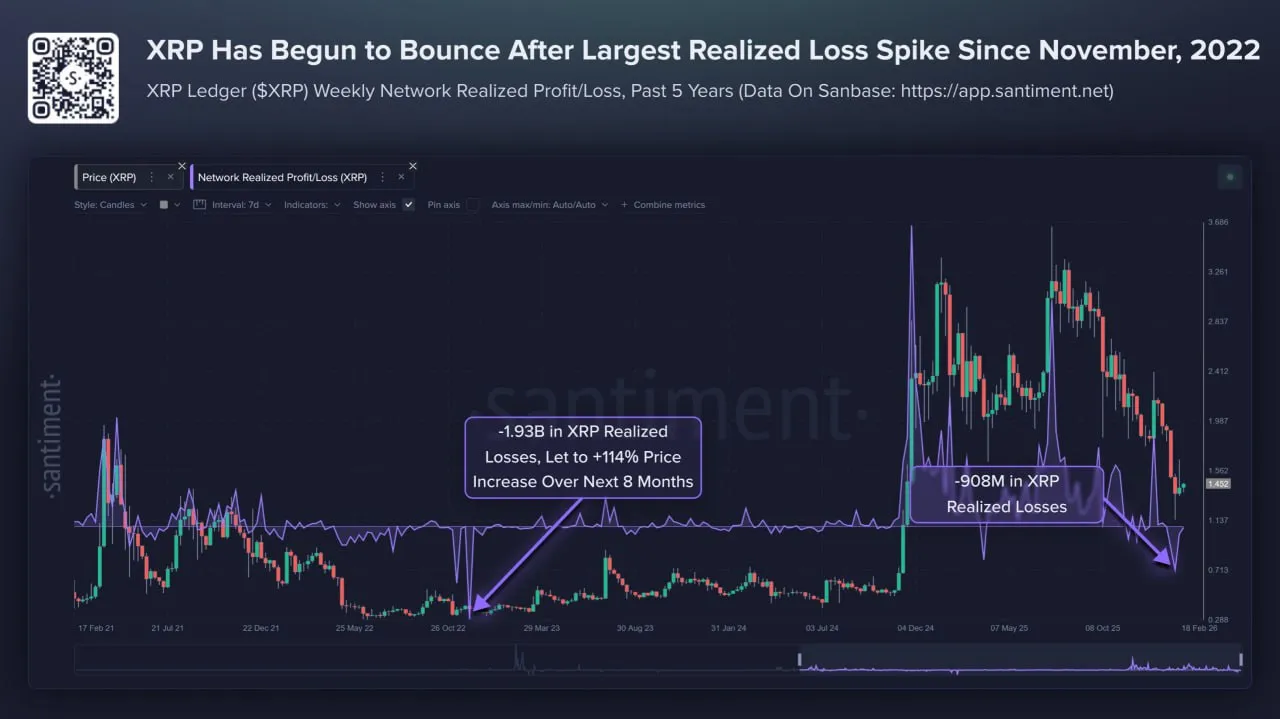
In the cryptocurrency market, maximum financial opportunity is often born from maximum retail pain. Recent on-chain data from the blockchain analytics firm Santiment has triggered a massive contrarian signal for XRP. The volume of "realized losses" across the XRP network has violently spiked, reaching levels not seen since the FTX collapse in November 2022.
Historically, when retail traders panic and sell their holdings at a massive deficit, it signals a phase of market capitulation. The transfer of assets from "weak hands" to institutional "strong hands" often sets the stage for a significant price bounce. However, timing this exact bottom requires nerves of steel and a deep understanding of on-chain metrics.
Risk Disclosure: Trading based on capitulation signals is an inherently high-risk contrarian strategy, often referred to as "catching a falling knife." While high realized losses historically precede rallies, a downtrend can extend much further than anticipated. Never invest more than you can afford to lose, and always utilize strict stop-loss orders. The SEC warns investors about the extreme volatility of digital assets.
Featured Snippet Answer: In on-chain analytics, "realized losses" occur when a cryptocurrency (like XRP) is moved or sold at a lower price than when it was originally acquired. A massive spike in network realized losses indicates that a large number of investors are simultaneously panic-selling their assets at a deficit, an event widely known as market capitulation.
To fully grasp the severity of the Santiment data, we must understand how the Network Realized Profit/Loss (NRPL) metric is calculated by on-chain forensics:
- The Timestamp: The blockchain records the exact price of XRP the last time a specific wallet moved the tokens.
- The Sell Event: When those tokens are moved again (typically to an exchange to be sold), the algorithm calculates the difference between the current price and the original acquisition price.
- The Metric: If the current price is lower, the network registers a "Realized Loss." A massive aggregate spike means the collective market is bleeding capital.
The comparison to November 2022 is critical. That month marked the absolute bottom of the previous bear market cycle, driven by the collapse of the FTX exchange. If 2026 is producing similar panic metrics, it suggests a complete psychological reset among XRP holders.
Why do professional traders celebrate when others are losing money? It comes down to market liquidity and supply exhaustion.
The Mechanics of a Capitulation Bounce:
- Supply Flush: When an asset drops continuously, investors hold on hoping for a breakeven point. Eventually, a psychological breaking point is reached, and everyone sells at once. This flushes all the "overhang" supply out of the market.
- Smart Money Accumulation: Institutional algorithms and market makers place massive buy limit orders below current support levels to absorb this panic selling. (Notably, recent ETF flow data indicates continuous, albeit small, institutional inflows into XRP ETFs precisely during this retail sell-off).
- The Rebound: Once the panic sellers are out of assets to dump, the selling pressure instantly evaporates. Any new buying volume, finding no resistance, causes the price to snap upward violently.
For a deeper understanding of this psychological phenomenon, Investopedia's guide to Contrarian Investing outlines how institutional players bet against the herd.
From the perspective of a trading desk, navigating a capitulation event is the most challenging aspect of technical analysis.
A Scenario of Premature Entry: During the November 2022 XRP capitulation, the NRPL metric flashed a massive loss signal.
- The Mistake: Many retail traders immediately opened 10x leveraged long positions, assuming the absolute bottom was in for the day.
- The Reality: Capitulation is a process, not a single timestamp. The market continued to slide sideways for another 72 hours, triggering a cascade of liquidations for those who bought the initial dip with tight stop-losses.
- The Execution: Professional traders do not buy the exact bottom of the red candle. They wait for the panic volume to subside, look for a bullish divergence on lower timeframes (like the 4-hour RSI), and enter only when the price begins to print higher lows.
The Santiment data flashing a multi-year high in realized losses is one of the most reliable macroeconomic bottom indicators available for XRP. It confirms that the weak hands have exited the market at a significant deficit. While the short-term price action may remain highly volatile, the historical precedent is clear: the period of maximum financial pain is almost always followed by the period of maximum financial opportunity.
Q: Does a spike in realized losses guarantee an XRP price increase? A: No metric guarantees a price increase. While it signals that selling pressure is likely nearing exhaustion, macroeconomic factors (such as broader stock market trends or regulatory news) can still force the price lower.
Q: How do analysts know if people are selling at a loss? A: Because blockchains are public ledgers, analytical tools like Santiment can track the price of a token when it enters a wallet and compare it to the price when it leaves that wallet. This creates an exact aggregate of profits and losses.
Q: What is a "Contrarian" investor? A: A contrarian is an investor who intentionally acts against prevailing market trends by buying when most others are selling in a panic, and selling when others are buying in a state of euphoria.
- Primary Data Source: Santiment - On-Chain and Social Metrics
- Market Psychology: Investopedia - Contrarian Investing
- Risk Management: SEC.gov - Ten Things to Consider Before You Invest
- Technical Concepts: Investopedia - Capitulation