
📣 Create Blog for Traders!
Stop Watching news - Start Making it.
START


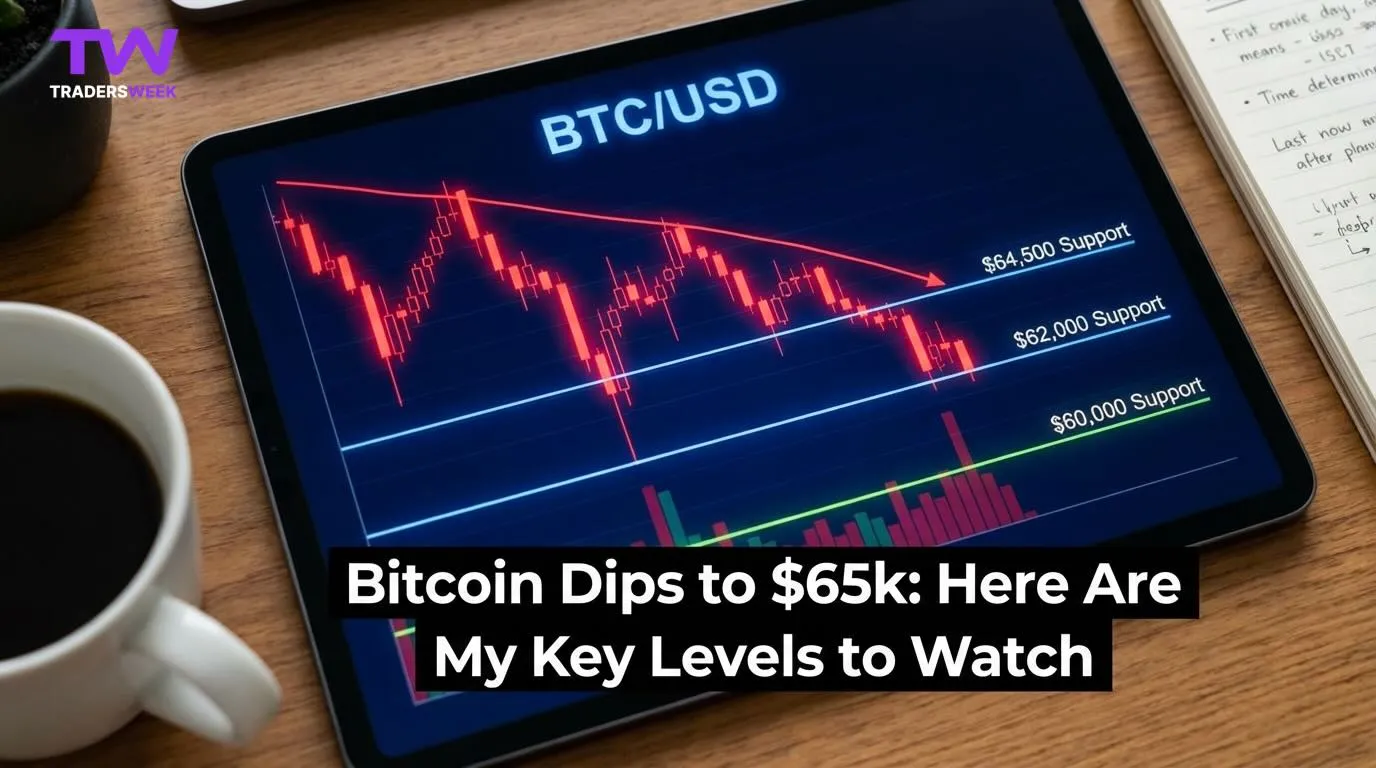
Bitcoin Dips to $65k: Here Are My Key Levels to Watch
This isn't just another price drop. The on-chain data is telling a different story, and I'm positioning my portfolio accordingly. Here's my strategy.
Last time we saw a leveraged flush-out this clean was back in early March. Everyone is glued to the charts, but honestly, the price is the least interesting part of this story. While Bitcoin took a 4.3% haircut down to $65,073, the real action is happening beneath the surface in the DeFi ecosystem. My colleague Marcus Cole is probably drawing triangles on the 1-hour chart, and that’s a valid approach, but I'm focused on the liquidation engines, the health of lending protocols, and the flow of stablecoins. This drop isn't a bug; it's a feature of the system designed to wipe out over-leveraged traders. And it's creating opportunities if you know where to look.
Look, price is just a lagging indicator of sentiment and capital flows. During moments like this, I fire up my custom dashboards and DefiLlama to see the truth. Where is the money actually going? Are stables flowing onto exchanges to buy the dip, or are they fleeing to safety? Is Total Value Locked (TVL) in protocols like AAVE and MKR holding up, or are we seeing a mass exodus? This morning, I saw a spike in liquidations on-chain long before the price on Coinbase reflected the panic. That's the edge. This volatility is also a stark reminder of why I've allocated 20% of my portfolio to RWA tokens. While everyone panics about BTC, the value locked in protocols dealing with tokenized real world assets remains remarkably stable. It's the bridge that's slowly being built while the crypto-native markets burn.
When a dip happens, I don't just stare at the price. I have a process. First, I check the derivatives market. Are funding rates negative? That tells me shorts are piling in and paying a premium, which can lead to a squeeze. Second, I look at exchange inflows/outflows. Are whales depositing BTC to sell, or are they withdrawing to cold storage? Third, I analyze the health of major DeFi protocols. I read the latest governance proposals and check for any unusual activity. This is where having a good smart contract audit guide becomes critical; you need to be able to quickly assess if a protocol is robust enough to handle this kind of stress. It's not about predicting the bottom to the dollar; it's about understanding the system's resilience.
Okay, let's talk levels. I'm not a day trader, so I'm looking at major structural points that align with on-chain data, specifically the cost basis for different investor cohorts. Forget the noise in between.
- Key Support Zone: $62,500 - $63,800. This isn't just a line on a chart; it's near the Short-Term Holder's Realized Price. A sustained break below this would be a major red flag, indicating new buyers are now underwater.
- The Line in the Sand: $59,000. This was the consolidation zone before the last major leg up. A drop to here would likely trigger a cascade of liquidations. I have buy orders layered below this, but I'm not expecting it to hit.
- First Resistance: $66,700. We need to reclaim this level to show buyers are stepping back in with conviction. I'm watching the volume on any attempt to break through here.
- Major Resistance: $69,000. The old all-time high. Psychologically and technically, this is the level bulls need to conquer to signal the dip is over.
This whole scenario isn't happening in a bubble, either. The macro environment is shifting, something Alex Volkov covers well in his analysis. Institutional players are far more sensitive to macro winds than degen farmers who were aping into YAMs at 3 AM with me back in 2020. Those were wild times, but the market is different now. More mature, in some ways.
My bullish-to-neutral stance relies on the $62,500 support zone holding firm. If we start seeing daily closes below that level, especially on high volume, I'll cut some of my more experimental positions. The biggest risk here isn't just price; it's contagion. A major DeFi protocol failing under this stress could trigger a much deeper deleveraging event across the entire space. That's why I read audit reports for fun—if you can't read the audit, you shouldn't be investing. Never forget the smart contract risk.
Price is the last thing to move. The real story is in the on-chain data, the health of DeFi protocols, and the flow of capital. The chart just confirms what the blockchain already told you.
My strategy is simple: I'm not selling my core ETH or DeFi blue chips. I am, however, using this dip to rebalance slightly, taking some profit from winners over the last few months and adding to my RWA positions. The stability they offer during these drawdowns is becoming undeniable. So, the question isn't just 'where does Bitcoin's price go next?' but rather, 'is your portfolio built to withstand the journey?'
Read More on TradersWeek:→ Crypto Fear Hits Max: My DeFi Strategy for This Dip→ Bitcoin Dumps: Are You Buying This Dip or Getting Trapped?→ Tether FUD Is Back: My Bitcoin Game Plan for the Chaos
BTCUSD chart · Powered by Finviz
Trading ToolsStock Screener · Crypto Heatmap · Try FINVIZ Elite Free