
📣 Create Blog for Traders!
Stop Watching news - Start Making it.
START


Ethereum's 9-Month Cycle? I'm Calling It Noise.
Everyone's talking about a mystical 9-month cycle for ETH. My on-chain data shows the real story, and it's not about the calendar.
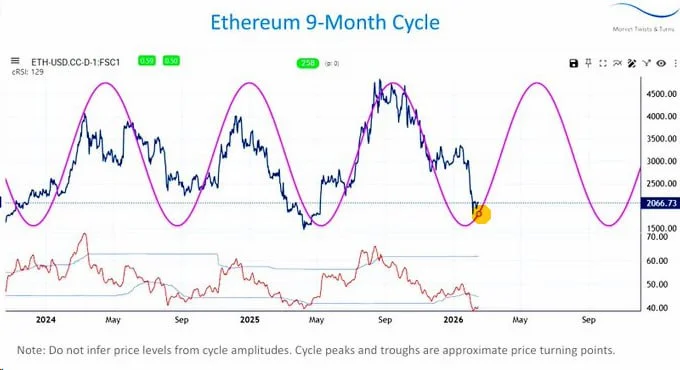
I keep seeing this narrative pop up: Ethereum is on the verge of a massive rally because of a 9-month cycle. My first thought this morning, looking at my Glassnode dashboard? That's chart astrology. While traders are busy drawing circles on a calendar, they're missing the hard data that actually moves markets. I survived the 2018 crash by ignoring narratives and focusing on capital flows. This time is no different.
Let's talk facts. Over the last seven days, I've tracked a net outflow of over 150,000 ETH from centralized exchanges. That's real conviction. That's smart money moving coins into cold storage or into DeFi protocols, which my colleague Luna Park covers brilliantly. This isn't some predictive cycle; it's a present-tense supply shock in the making. This is a far more reliable crypto market sentiment indicator than any time-based theory. People don't move that kind of volume off exchanges unless they plan on holding for a while.
The classic bitcoin vs ethereum comparison always comes down to market dominance. Right now, Bitcoin Dominance (BTC.D) is getting rejected from a key multi-month resistance zone around 56%. I've been watching this setup since last week. A sustained rejection here is the single biggest catalyst for a broader altcoin rally, with ETH leading the charge. While everyone is making their bitcoin price prediction this week after the drop to $64,880, I'm watching what its dominance does. If BTC.D breaks down, ETH will fly, regardless of what month it is. It's that simple.
So, am I buying? Not blindly. I'm a trader, not a tourist. I'm watching these levels on my 4H chart:
- Key Support: The $3,350 zone. This is where I have my first bids set.
- Major Resistance: A clean break and hold above $3,680 is my confirmation for a larger move.
- Invalidation: A daily close below the 200-day MA, currently around $3,100, and I'm out. Risk management is everything.
This is a much cleaner way to trade the market than relying on a cycle theory that could fall apart at any moment. As Jake Morrison often points out, macro conditions can invalidate any pattern, and right now, the macro is choppy at best. I'm trading the price action and the flow of money.
Forget the astrology of 9-month cycles. Watch the exchange flows and Bitcoin Dominance—that's where the real alpha is.
My position is simple: I'll trust the flow of billions of dollars over a pattern on a calendar every single time. Are we, as traders, over-complicating our analysis with these esoteric theories when the simple on-chain data is telling us everything we need to know?